If your debugging workflow is “add a print(), rerun, delete the print(),” you are leaving time on the table. Python ships with pdb, a full interactive debugger, in the standard library. No install. No config. You can pause your program mid-execution, walk through it line by line, and inspect any variable.
This is a hands-on guide. We will debug a real (broken) script together. Every screenshot is from an actual terminal session.
1. Why pdb Beats print()
A print() tells you the value of one variable at one moment. pdb lets you:
- Pause execution at any line (breakpoints).
- Step forward one line, or step into a function call.
- Print or evaluate any expression at that exact moment.
- Walk the call stack to see how you got there.
2. The Minimal Way: breakpoint()
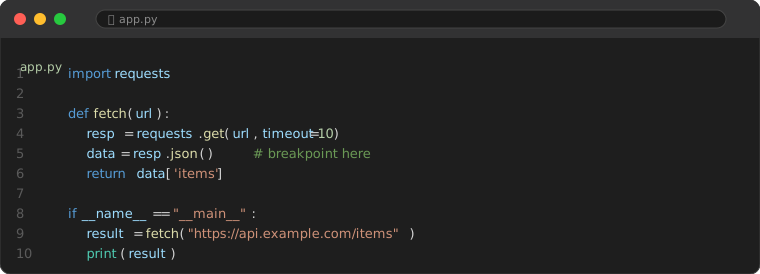
Python 3.7+ has a built-in breakpoint() function. Drop it wherever you want to pause:
def fetch(url):
    resp = requests.get(url, timeout=10)
    data = resp.json()
    breakpoint()          # execution pauses here
    return data['items']

result = fetch("https://api.example.com/items")
Run the script normally with python app.py. It freezes at breakpoint() and drops you into the (Pdb) prompt. Type p data to print data, n for next line, c to continue.
3. A Real Debugging Session
More often you want to start debugging from the command line without editing code. Use python -m pdb app.py. Here is a session where I set a breakpoint, continue to it, and inspect a variable:
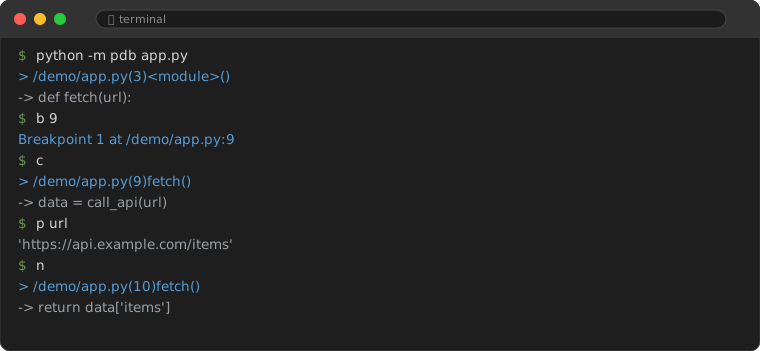
The key commands I use 90% of the time:
| Command | Short | What it does |
|---|---|---|
next | n | Run the current line, stop at the next line in this function |
step | s | Step into the function being called |
continue | c | Resume until the next breakpoint |
break | b | Set a breakpoint (b 42 for line 42) |
print | p | Evaluate and print an expression |
list | l | Show the source around the current line |
where | w | Print the call stack |
quit | q | Exit the debugger |
4. Post-Mortem Debugging (My Favorite Trick)
A script crashed with a traceback. Instead of rerunning and hoping to reproduce it, re-run it under pdb and it pauses exactly at the crash:
python -m pdb app.pyBut the real magic is pdb.pm(). After a crash in an interactive session, call it to jump straight back into the stack at the failure point:
import pdb
pdb.pm()   # re-enter the traceback, inspect the dead frame
Here is what that looks like when a KeyError hides a real API problem:
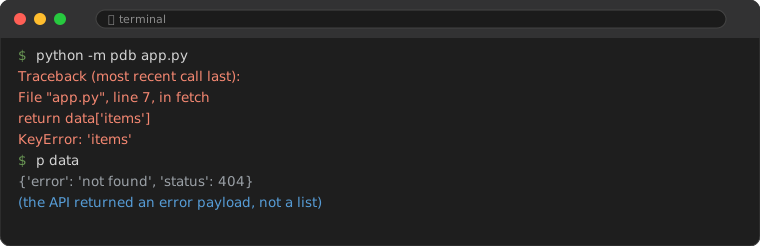
In this case the bug was not “data['items'] is wrong” — the API had returned {"error": "not found", "status": 404}. A print() at the top would never have shown me that the response shape changed. Pausing at the crash did.
5. Save Time with .pdbrc
Create a ~/.pdbrc file to alias commands you type constantly. Mine:
alias ll list
alias pr pprint
alias cls !import os; os.system('clear')
Now ll lists source and pr obj pretty-prints. Small, but it adds up across a week of debugging.
6. pdb vs the VS Code Debugger
The VS Code debugger gives you clickable breakpoints and variable panes — great when you are in an editor. pdb is better when:
- You are on a remote server with no GUI.
- You are inside a
docker execshell or CI log. - The bug only reproduces in a production-like environment.
Learn both. They solve different situations.
7. Mistakes That Waste an Hour
- Forgetting the import. Old Python needs
import pdb; pdb.set_trace(). On 3.7+ just usebreakpoint(). - Stepping into library code.
sdives into requests internals. Usento stay in your function. - Editing code while paused. pdb does not reload your file. Exit, edit, rerun.
- Leaving breakpoint() in production. It opens an interactive prompt that hangs servers. Remove it before deploying.
Frequently Asked Questions
Is pdb the same as the VS Code debugger?
Conceptually yes — both let you set breakpoints and inspect state. VS Code wraps a debugger (debugpy) in a GUI; pdb is the command-line original. Skills transfer between them.
Can I use pdb with pytest?
Yes: pytest --pdb drops into pdb on the first failure, and pytest --trace breaks at the start of each test. Indispensable for flaky tests.
What about richer debuggers like pudb or ipdb?
ipdb adds tab-completion and syntax highlighting on top of pdb and is my recommendation if you want a nicer prompt. pudb gives a full-screen curses UI. Both are pip install away.
That is enough pdb to debug almost anything. Next time a script misbehaves, resist the print() reflex and open (Pdb) instead.